
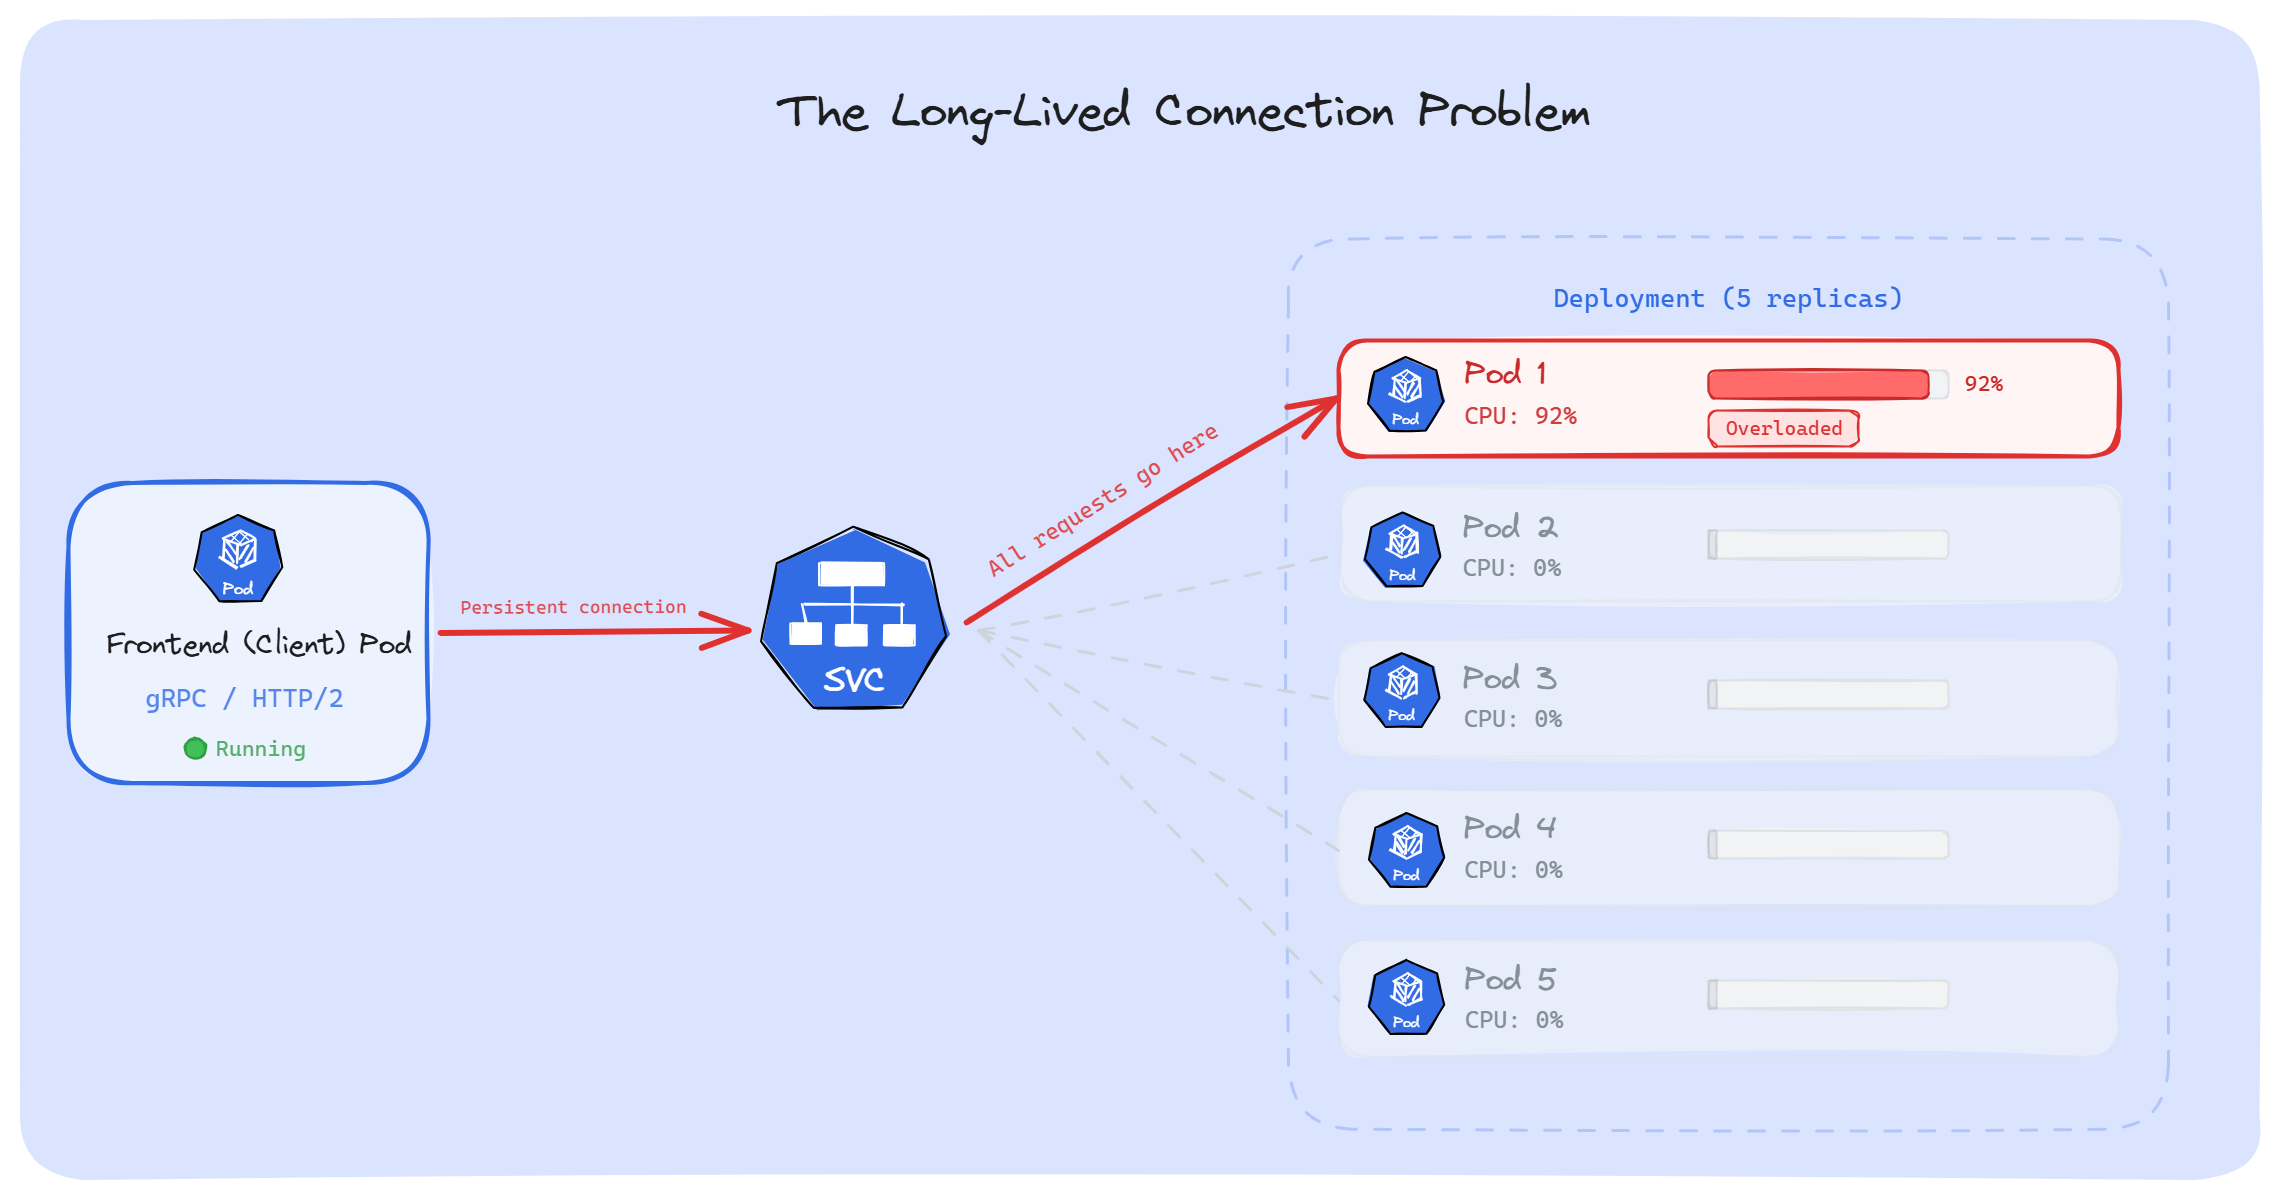
A few months ago, we had a gRPC service running in production. Traffic was growing, so we scaled it up; 5 replicas to 10. But when we checked the metrics, only 2 Pods were actually doing the work. The rest were sitting with almost zero CPU usage. HPA kept adding Pods, and it changed nothing.
What was going on? Kubernetes doesn't load balance long-lived connections.
When our app uses a persistent TCP connection such as gRPC, HTTP/2, WebSockets, database pools and AMQP, Kubernetes picks a backend Pod once. Every request after that goes through the same connection to the same Pod. The other replicas never receive any requests.
In this article, we'll walk through why this happens, which workloads are affected, and how to fix it.
Before we talk about long-lived connections, we need to understand how Kubernetes routes traffic. Most of us have a wrong picture of how this works.
When we create a Service, Kubernetes gives it an IP address; a virtual IP. But nothing is actually listening on that IP. No container, no process, no app. If we SSH into any node and run netstat -ntlp, we won't find the Service IP. Nothing is running on it.
So how does traffic reach our Pods? That's where kube-proxy comes in.
kube-proxy runs on every node as a DaemonSet. It watches the API server for any changes in Services and EndpointSlices, and then writes rules in the node's kernel. In iptables mode (still the default on most clusters), these rules go into the iptables NAT table.
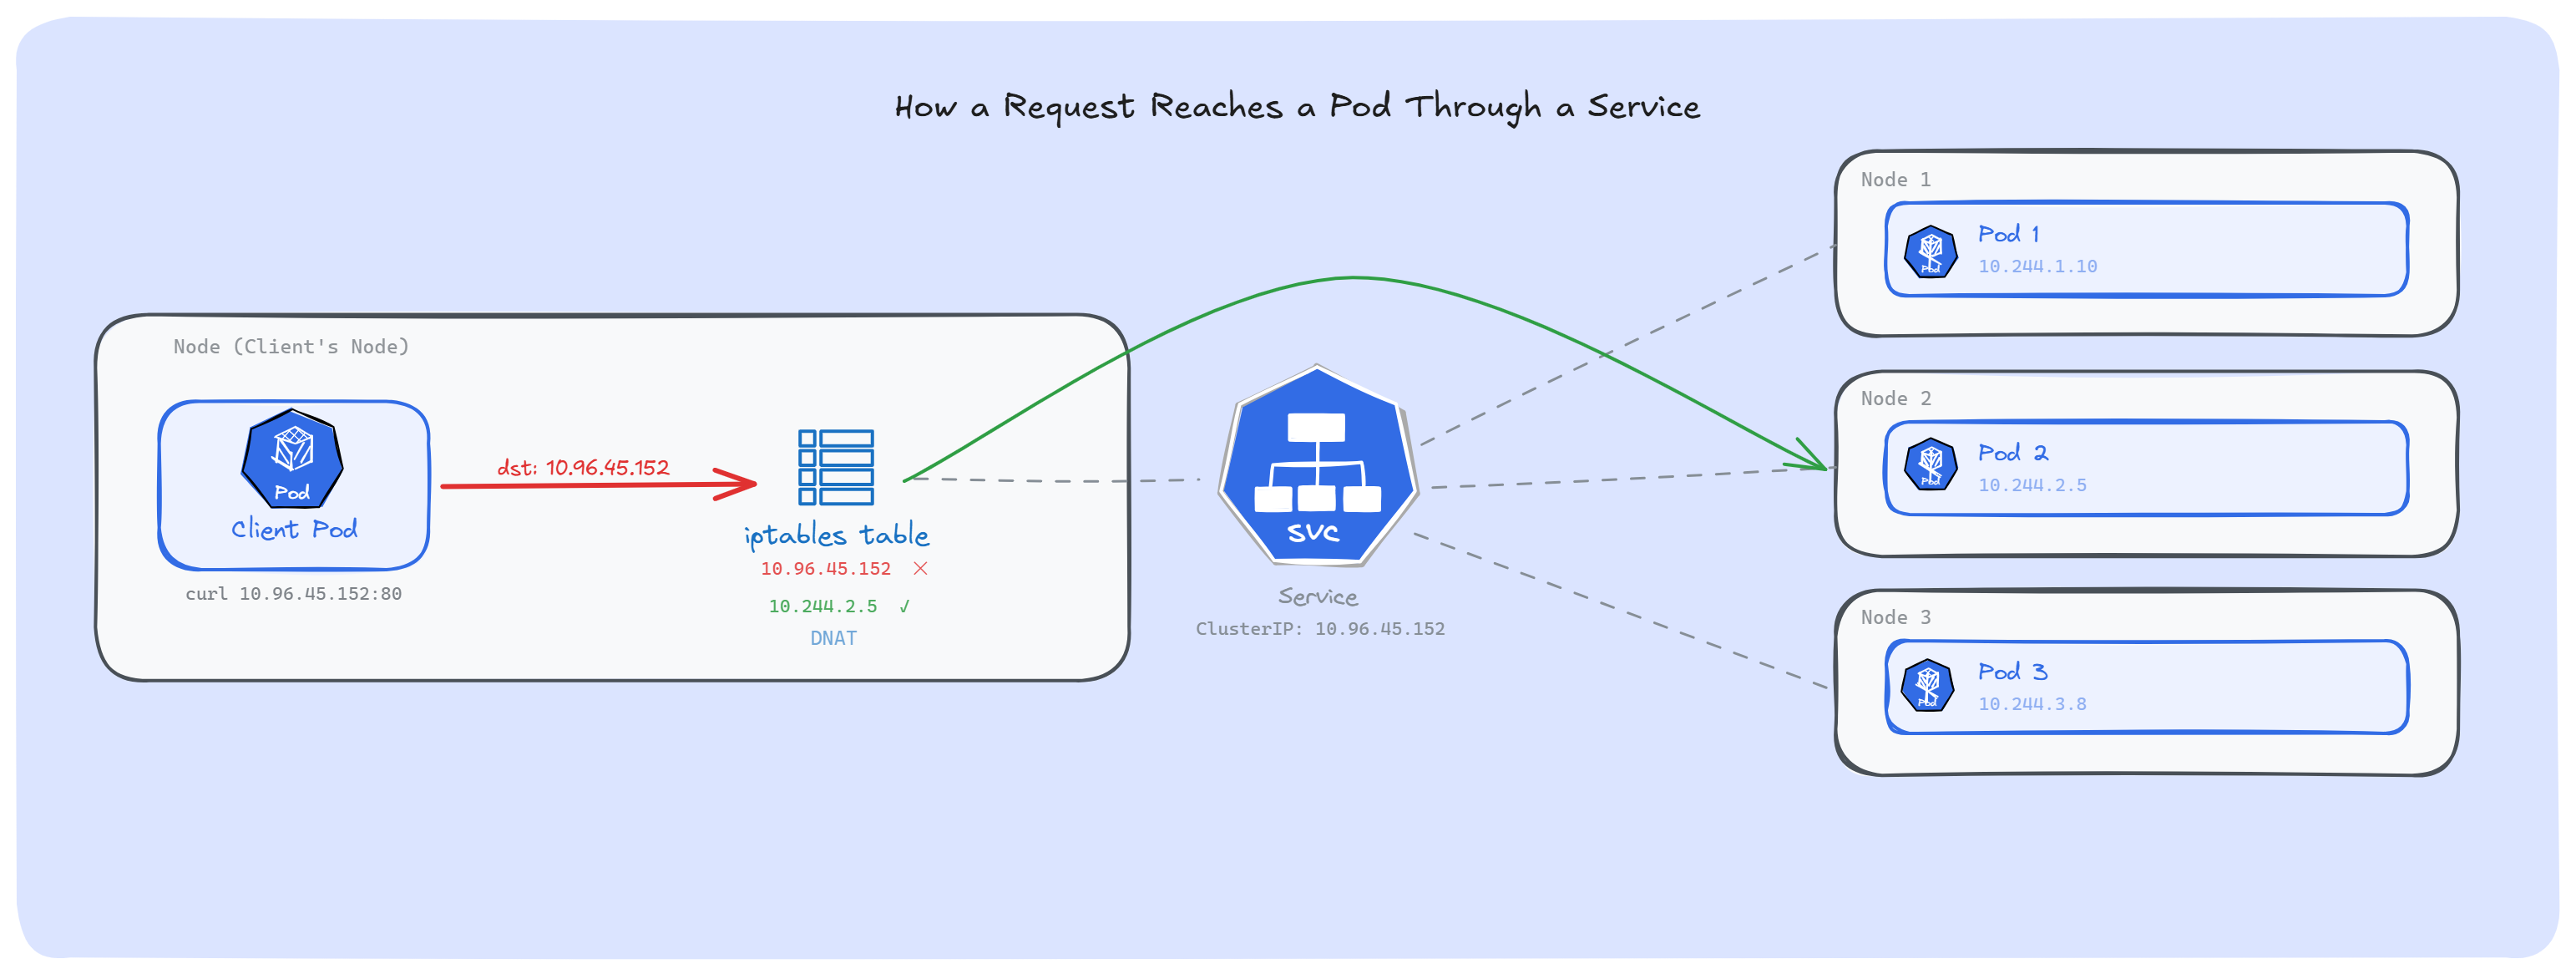
These rules are simple: "If traffic is heading to this Service IP, change the destination to one of the backend Pod IPs."
That's all a Service really is; a set of rewrite rules sitting in the kernel. The virtual IP is just a placeholder. A routing trick.
For example, when a Pod sends a request to a Service IP, the traffic doesn't actually go looking for that IP. Before it leaves the node, iptables catches it, picks one of the backend Pod IPs, changes the destination, and sends the traffic straight to the real Pod. The Client Pod doesn't know that this happened.
Note: We can see these rules ourselves: run iptables -t nat -L -n | grep <service-cluster-ip> on any node, and we will find the KUBE-SVC and KUBE-SEP chains that kube-proxy created for that Service.
Most of us assume Services use round-robin to spread traffic. They don't.
iptables was built as a firewall, not a load balancer. It has no round-robin built in. What kube-proxy does instead is use the iptables statistic module in random mode.
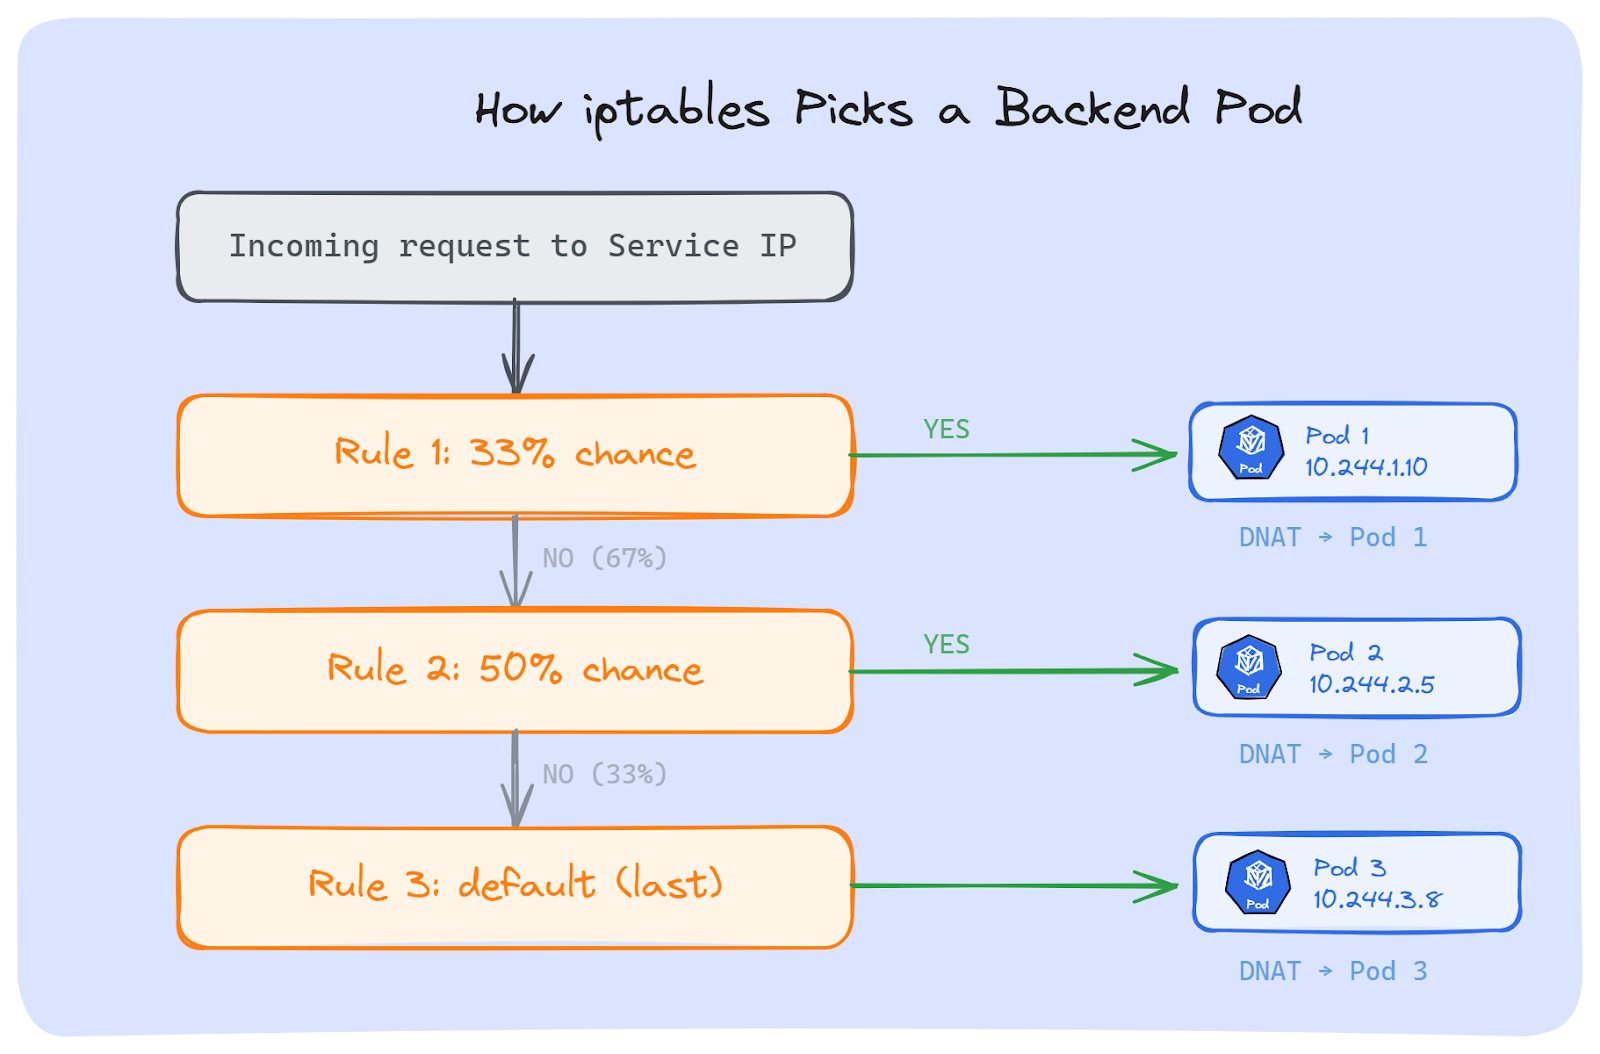
Suppose we have a Service with 3 backend Pods. kube-proxy creates these rules:
Rule 1: With 33% chance → send to Pod 1. Otherwise, move to next rule.
Rule 2: With 50% chance → send to Pod 2. Otherwise, move to next rule.
Rule 3: Send to Pod 3 (last one, no chance needed).
The math works out. Rule 1 catches 33% of traffic. Rule 2 gets 50% of the remaining 67%, which is another 33%. Rule 3 gets whatever is left; the final 33%. Each Pod ends up with roughly equal share. But the pick is random, not one after another.
If we run iptables-save on a node, we can see these exact rules:
-A KUBE-SVC-XXXX -m statistic --mode random --probability 0.33333 -j KUBE-SEP-POD1
-A KUBE-SVC-XXXX -m statistic --mode random --probability 0.50000 -j KUBE-SEP-POD2
-A KUBE-SVC-XXXX -j KUBE-SEP-POD3
Each KUBE-SEP chain does a DNAT; it changes the destination IP(Service IP) to the actual Pod IP.
Now, iptables isn't the only option. kube-proxy supports other proxy modes too:
1. IPVS: It was the popular choice for large clusters. It uses hash tables instead of checking rules one by one, so it's much faster. It also supports real load balancing methods like round-robin and least connections. But as of Kubernetes 1.35, IPVS mode is deprecated. The Kubernetes networking team decided it wasn't worth maintaining anymore.
2. nftables: It is the replacement for iptables in the Linux kernel. Kubernetes 1.33 made it stable. It's faster and handles rules better at scale. Like iptables mode, it picks a backend Pod at random by default.
Some clusters skip Kube-proxy entirely. eBPF-based CNI plugins like Cilium handle all routing directly inside the kernel. It's the fastest option, but it requires a compatible CNI plugin.
Note: It doesn't matter which approach we use, kube-proxy (iptables, IPVS, nftables) or eBPF (Cilium); all of them pick a backend Pod once, when the TCP connection is created. After that, every request on that connection goes to the same Pod. The kernel remembers this connection and keeps sending all traffic on it to that same Pod.
This works fine for short-lived connections, but for long-lived connections, that's where things break.
As we now know, Kubernetes picks a backend Pod once, when the connection is created. After that, everything on that connection goes to the same Pod. Whether this causes a problem or not depends on one thing: how long that connection stays open. Let's discuss.
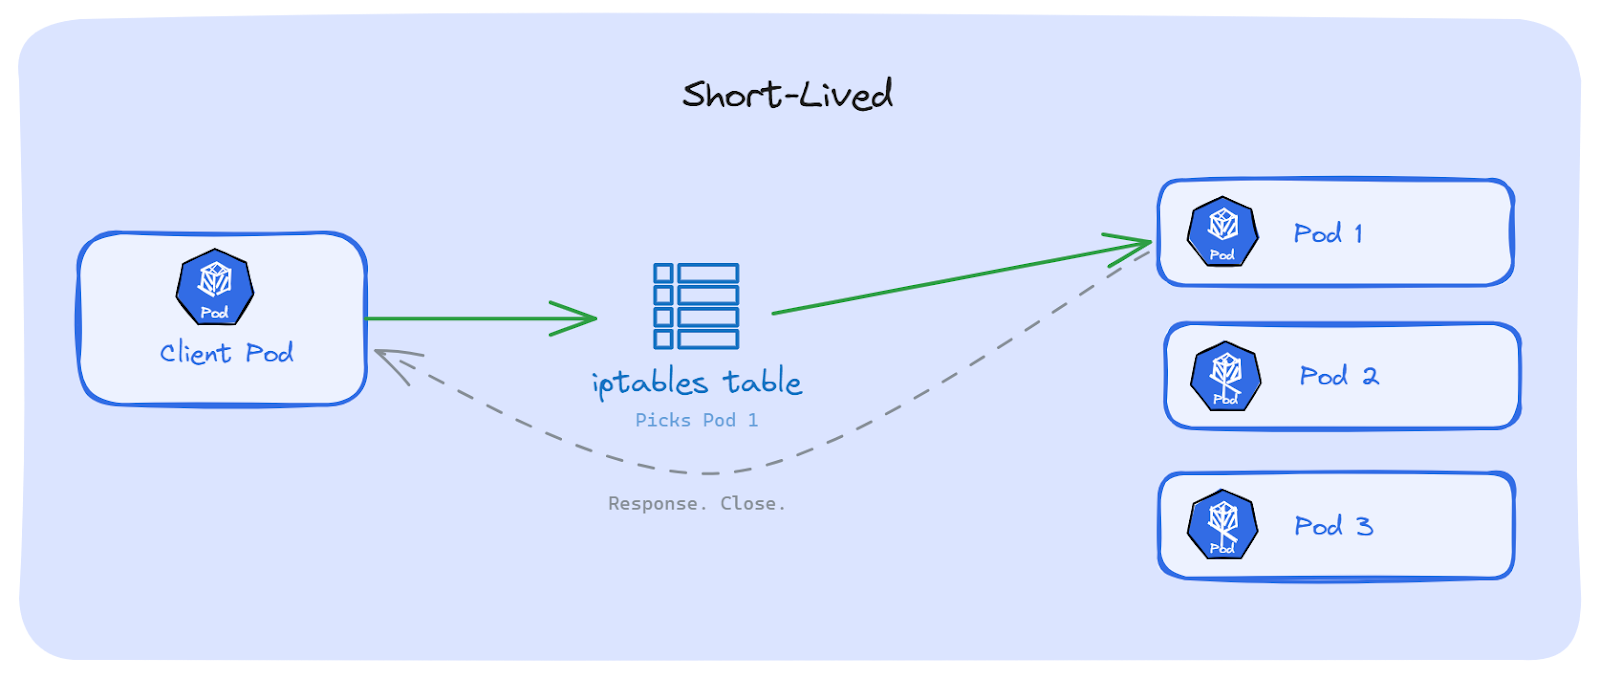
With classic HTTP/1.1 (without keep-alive), every request opens a new TCP connection. The request goes out, the response comes back, the connection closes. Done.
Next request? A brand new connection is open. iptables runs its random pick again. Maybe the same Pod, maybe a different one. Over hundreds of requests, traffic spreads across all Pods on its own. No problem.
Kubernetes Services handle this well.
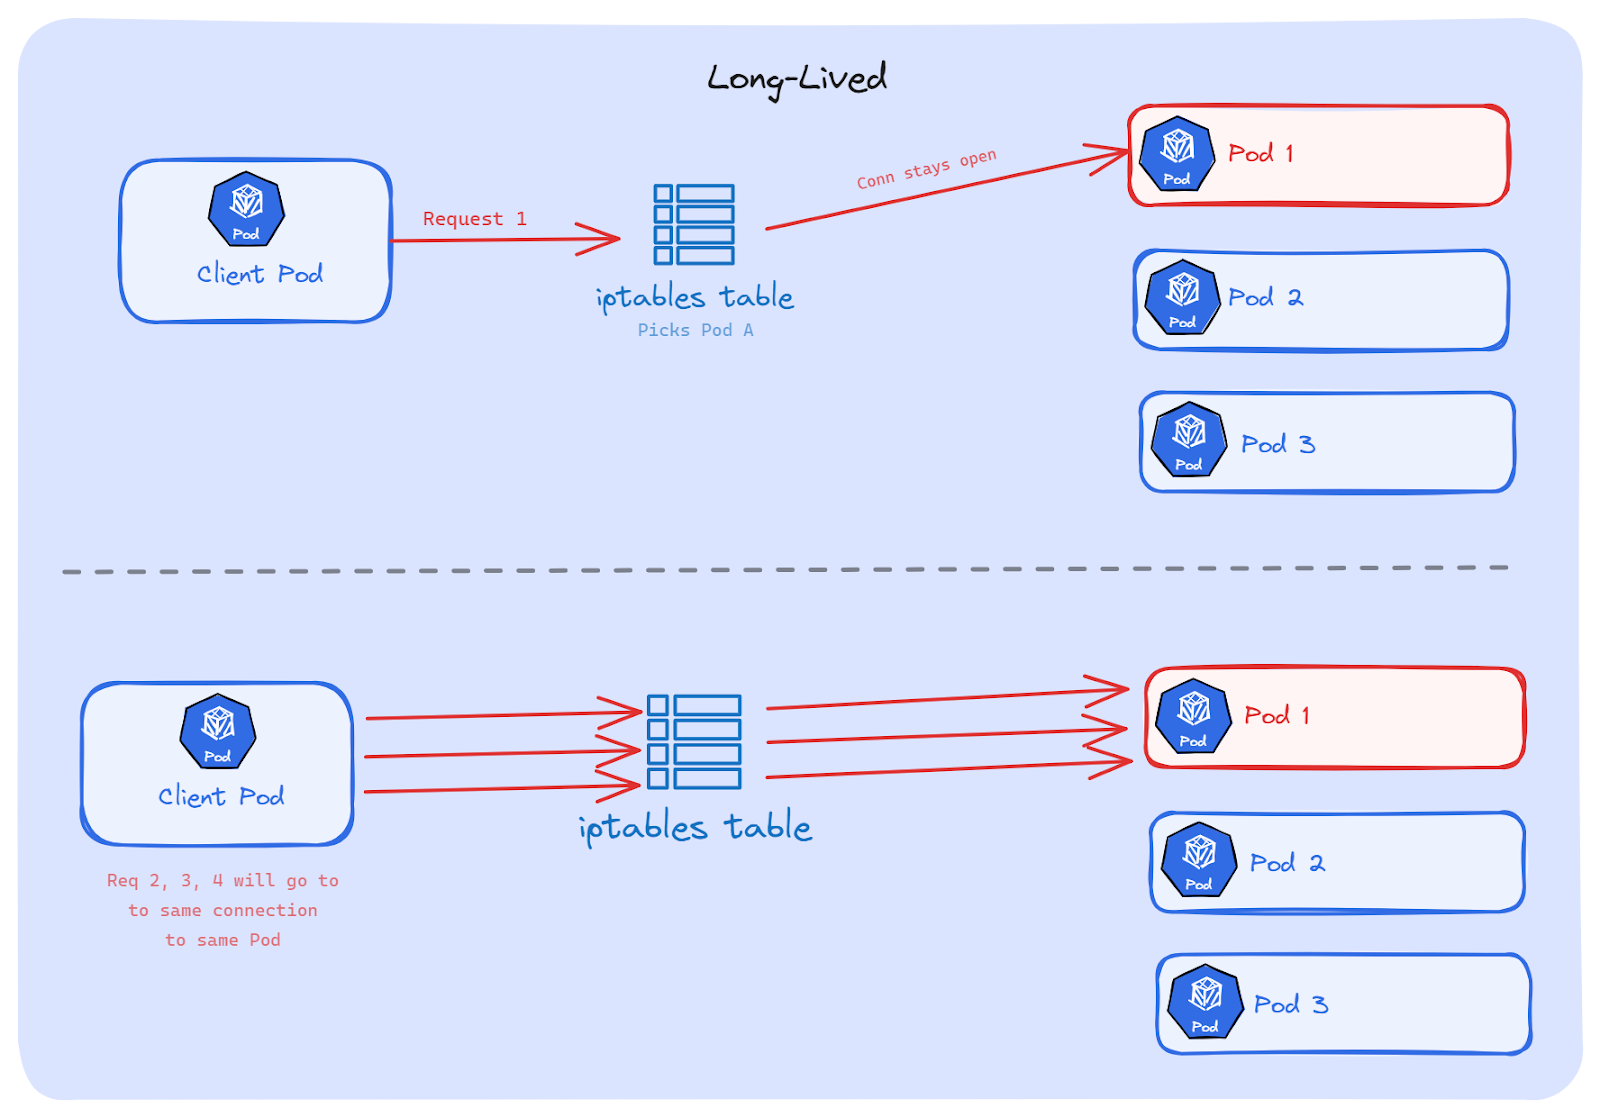
Now think about what happens when the connection doesn't close. The app opens a TCP connection once, and keeps sending requests over it. iptables picked a Pod on the very first connection. After that, iptables is not involved anymore. Every request goes through that same connection, to that same Pod; even if other Pods are free and ready.
This is the core mismatch: Kubernetes balances connections, not requests. But our apps send hundreds or thousands of requests over a single connection.
Which protocols use long-lived connections?
The following are the common ones we run in production:
HTTP keep-alive: Instead of opening a new connection for every request, the client reuses the same TCP connection for multiple requests. Most HTTP libraries have this turned on by default. So even simple REST calls between microservices might be using long-lived connections without us knowing.
HTTP/2: It sends many requests at the same time over a single TCP connection. This is called multiplexing; one connection, hundreds of requests, all going to the same Pod. Most modern web apps and API gateways use HTTP/2 today.
gRPC: It is built on HTTP/2, so it works the same way. One gRPC channel means one TCP connection. Every RPC call goes through it. This is how most microservice platforms work; Google and many others use gRPC for service-to-service calls.
WebSockets: It starts as a normal HTTP request, then turns into a two-way connection that stays open. It can last minutes, hours, sometimes days. We see this in chat apps, real-time dashboards, trading platforms, and gaming backends.
Database connections: Almost every app that talks to a database uses a connection pool. It opens a set of connections at startup and keeps them alive for the app's entire lifetime. PostgreSQL, MySQL, MongoDB, Redis; they all work this way. One connection pool, same Pods, forever.
AMQP and message queues: The consumers connect to brokers like RabbitMQ and hold that connection open to receive messages. These connections often live as long as the app itself is running.
The pattern is the same in all of these: the connection opens once and stays open for a long time. Kubernetes picks a Pod when the connection starts. After that, it can't move traffic to other Pods.
We know, the problem but why can't we fix this on its own? Let's break it down.
When a TCP connection is created, the kernel stores it in a table called conntrack (connection tracking). This table maps every connection using four things: source IP, source port, destination IP, destination port and the protocol. Together, they point to the Pod that was picked when the connection started.
As long as that connection is alive, every piece of traffic on it follows that same entry in the conntrack table. Same source, same destination, same Pod. Every time.
Kubernetes can't break this. It doesn't own the connection; the app does. The kernel just follows the conntrack entry until the connection closes. There is no built-in way in Kubernetes to say "move this connection to a different Pod."
This is where it gets painful in production.
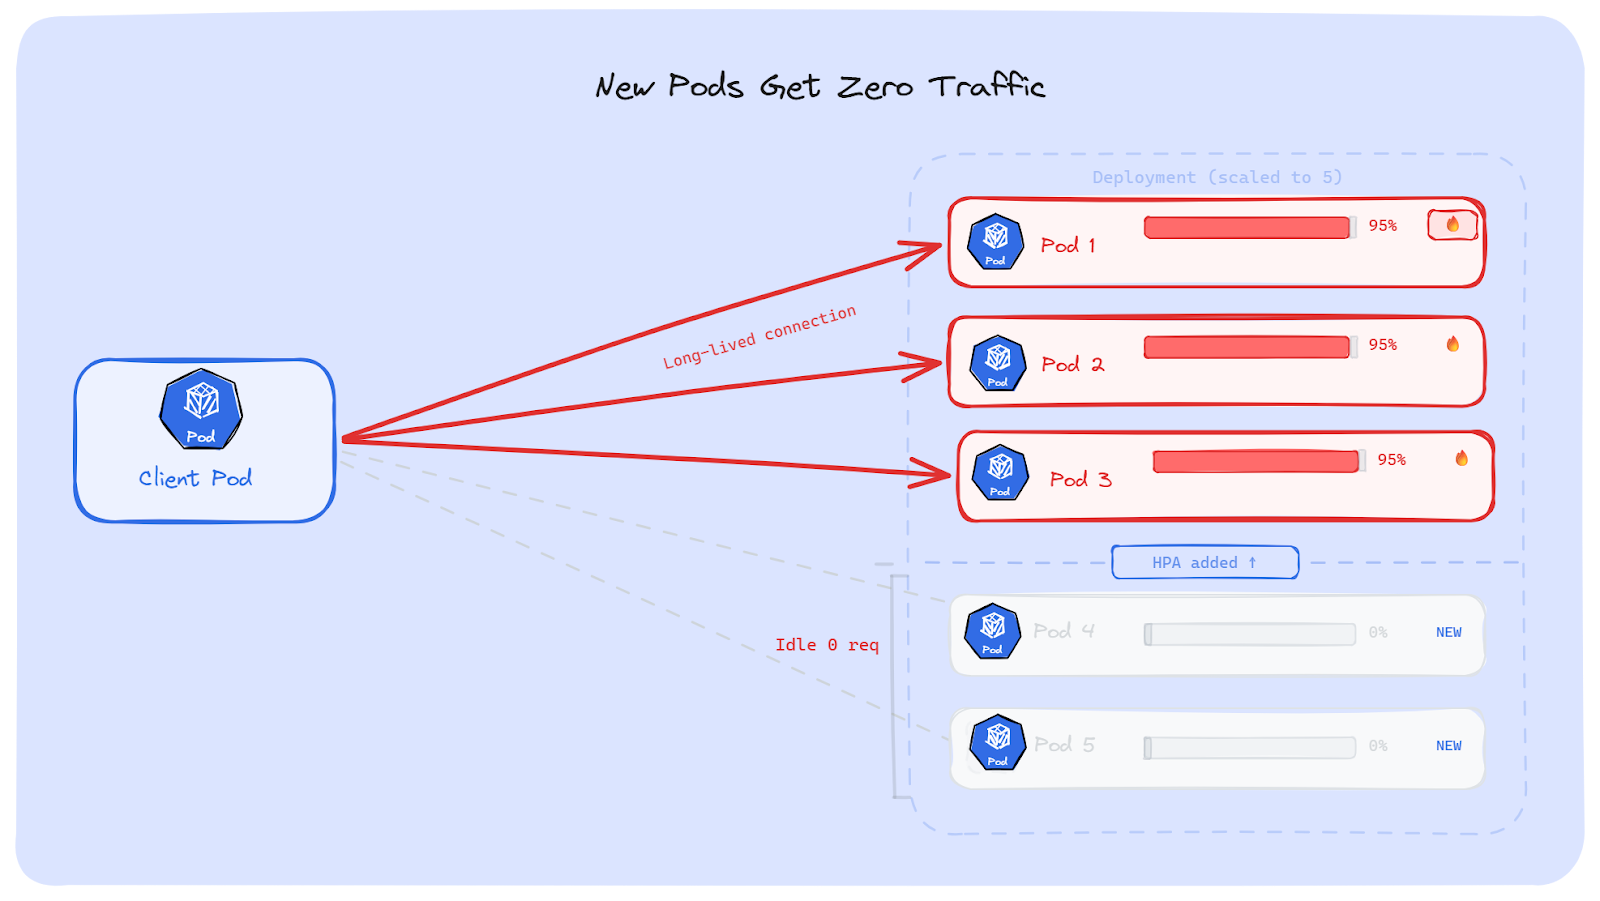
Suppose, our backend is getting slow. HPA sees high CPU and scales the Deployment from 3 Pods to 5. The five Pods are now running and healthy. But the clients already have open connections to the original 3 Pods. Those connections don't move. The new Pods are ready, but no one is talking to them.
The result: 3 old Pods are still overloaded. 2 new Pods sit there doing nothing. HPA did its job; it added Pods. But the traffic stayed on the old Pods.
The number of clients vs the number of servers matters a lot here.
If we have 5 client Pods connecting to 2 backend Pods; both backends will likely get some connections. The traffic won't be perfectly even, but both Pods will do some work. This is fine.
Now flip it. 2 client Pods connecting to 5 backend Pods. Each client opens one long-lived connection. At best, 2 out of 5 Pods get traffic. The other 3 do nothing. We're paying for 5 Pods, but only 2 are doing work.
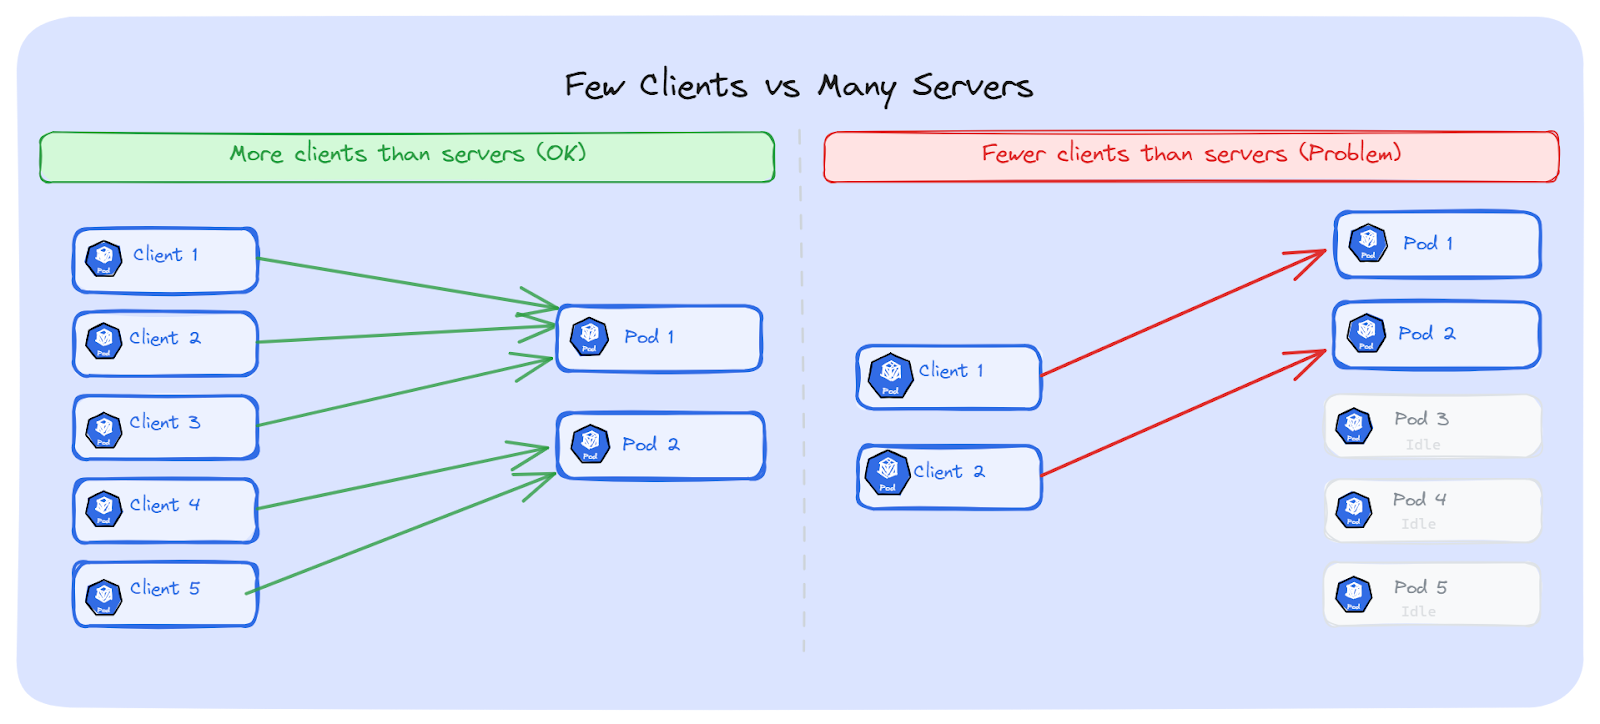
This is a very common setup. We can think of a single API gateway Pod or one frontend Pod connecting to many backend replicas. One connection, one Pod. The rest are wasted.
If we have fewer clients and more servers, the problem gets worse as we discussed before. There are a few solutions, depending on what protocol we use and how much we can change our setup. Let's discuss the solutions one by one.
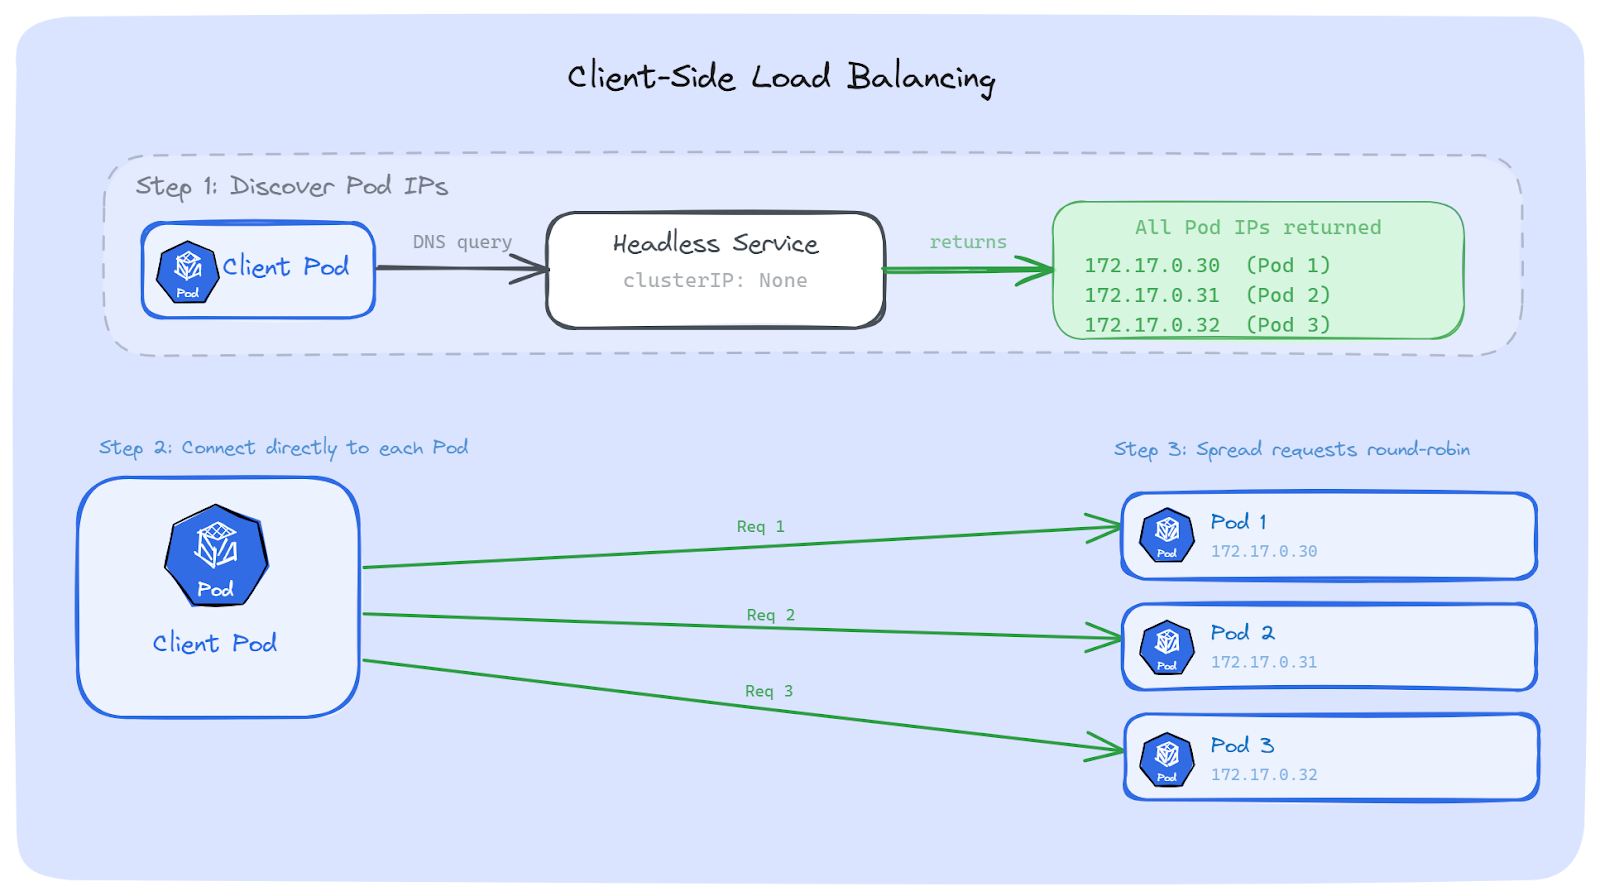
The first way to fix this is to move the load balancing decision from Kubernetes to our app. Instead of sending traffic to a Service IP, our app discovers all backend Pod IPs on its own and spreads requests across them.
The idea is simple:
This way, even if each connection is long-lived, requests still spread across all Pods because the client is the one deciding where each request goes.
A normal Service has a ClusterIP. When we do a DNS lookup, we get back one virtual IP. That IP goes through iptables, which picks one Pod, and we're back to the same problem.
A Headless Service is different. It has no ClusterIP. When we do a DNS lookup, we get back all the Pod IPs directly. No virtual IP. No iptables. Just real Pod addresses.
apiVersion: v1
kind: Service
metadata:
  name: my-backend-headless
spec:
  clusterIP: None          # This makes it headless
  selector:
    app: my-backend
  ports:
    - port: 8080
      targetPort: 8080
We can see the difference with a quick nslookup:
# Regular Service - returns one virtual IP
$ nslookup my-backend
Name:   my-backend.default.svc.cluster.local
Address: 10.96.45.152

# Headless Service - returns all Pod IPs
$ nslookup my-backend-headless
Name:   my-backend-headless.default.svc.cluster.local
Address: 172.17.0.30
Name:   my-backend-headless.default.svc.cluster.local
Address: 172.17.0.31
Name:   my-backend-headless.default.svc.cluster.local
Address: 172.17.0.32
With a regular Service, the client sees one IP. With a Headless Service, the client sees every Pod. That's what gives the client the information it needs to do its own load balancing.
gRPC has built-in support for client-side load balancing, which makes it one of the easier protocols to fix.
By default, gRPC uses a policy called pick_first. It connects to the first address it finds and sends all RPCs there. That's exactly the problem we've been talking about; one Pod gets everything.
The fix is to switch to round_robin. With this policy, the gRPC client connects to all addresses returned by DNS and sends each RPC to a different backend, one after another.
Here's how it looks in Go (using the current grpc.NewClient API):
conn, err := grpc.NewClient(
    "dns:///my-backend-headless.default.svc.cluster.local:8080",
    grpc.WithDefaultServiceConfig(`{"loadBalancingConfig": [{"round_robin":{}}]}`),
    grpc.WithTransportCredentials(insecure.NewCredentials()),
)
A few things to note here:
For more advanced setups, gRPC also supports xDS-based load balancing. This is a proxyless approach where a control plane (like an xDS server) tells the client which Pods are available, without relying on DNS at all. This is what large-scale teams use when DNS refresh is too slow or when they need smarter routing like weighted load balancing.
Client-side load balancing works well, but it comes with some extra work.
If we can't change our app code, or if we want a fix that works for any protocol, we can put a smart proxy between the client and the backend Pods. This proxy works at Layer 7; it understands HTTP requests, gRPC calls, and WebSocket messages inside the connection.
Kubernetes (kube-proxy) works at Layer 4. It sees TCP connections. It picks a Pod when the connection opens, and that's it. Every request on that connection goes to the same Pod.
A Layer 7 proxy sees deeper. It looks inside the connection and sees each individual request. For every request, it can pick a different Pod. The client opens one connection to the proxy, and the proxy spreads requests to all backend Pods.
This is the key difference:
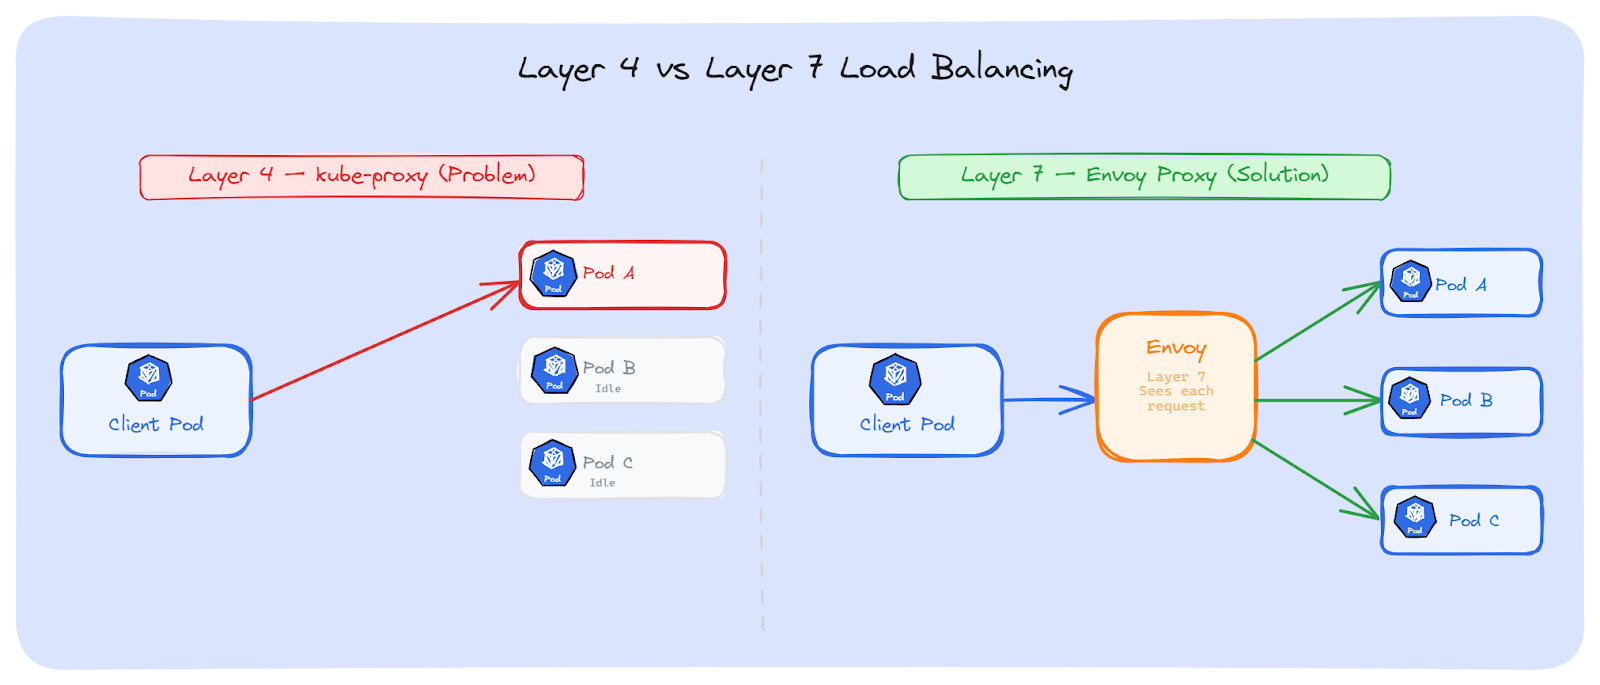
Envoy is the most common choice for Layer 7 load balancing in Kubernetes. It understands HTTP/2 and gRPC natively; it can see each individual request and gRPC call inside a connection and route them to different Pods
It supports multiple load balancing methods: round-robin, least-request, ring hash, maglev, and random. For most cases, round-robin or least-request is enough.
Envoy can be deployed as a sidecar next to our Pods, as a standalone proxy Deployment, or as a gateway at the edge of the cluster.
Here's a simple Envoy config that load balances gRPC traffic across backend Pods using a Headless Service:
static_resources:
  listeners:
    - name: grpc_listener
      address:
        socket_address:
          address: 0.0.0.0
          port_value: 8080
      filter_chains:
        - filters:
            - name: envoy.filters.network.http_connection_manager
              typed_config:
                "@type": type.googleapis.com/envoy.extensions.filters.network.http_connection_manager.v3.HttpConnectionManager
                stat_prefix: grpc
                codec_type: AUTO
                route_config:
                  name: local_route
                  virtual_hosts:
                    - name: backend
                      domains: ["*"]
                      routes:
                        - match:
                            prefix: "/"
                          route:
                            cluster: grpc_backend
                http_filters:
                  - name: envoy.filters.http.router
                    typed_config:
                      "@type": type.googleapis.com/envoy.extensions.filters.http.router.v3.Router
  clusters:
    - name: grpc_backend
      connect_timeout: 5s
      type: STRICT_DNS
      lb_policy: ROUND_ROBIN
      typed_extension_protocol_options:
        envoy.extensions.upstreams.http.v3.HttpProtocolOptions:
          "@type": type.googleapis.com/envoy.extensions.upstreams.http.v3.HttpProtocolOptions
          explicit_http_config:
            http2_protocol_options: {}
      load_assignment:
        cluster_name: grpc_backend
        endpoints:
          - lb_endpoints:
              - endpoint:
                  address:
                    socket_address:
                      address: my-backend-headless
                      port_value: 8080
A few things to note:
The client connects to Envoy with one long-lived connection. Envoy then opens its own connections to all backend Pods and spreads each request across them. The client doesn't change at all; it just talks to Envoy like it's the backend.
HAProxy: It has Strong support for WebSockets and persistent connections. It can pool connections to backends and spread requests across them. A good choice if your team already uses HAProxy and doesn't want to learn Envoy.
NGINX: With the upstream block and least_conn directive, NGINX can distribute requests across Pods. For gRPC, NGINX supports it natively with the grpc_pass directive since version 1.13.10. NGINX Plus adds gRPC-specific health checks on top.
Both work the same way as Envoy. We deploy them in front of our backend Pods, point them to a Headless Service, and they spread requests across all Pods.
Layer 7 proxies solve the problem without any changes to our app code. But they add some overhead:
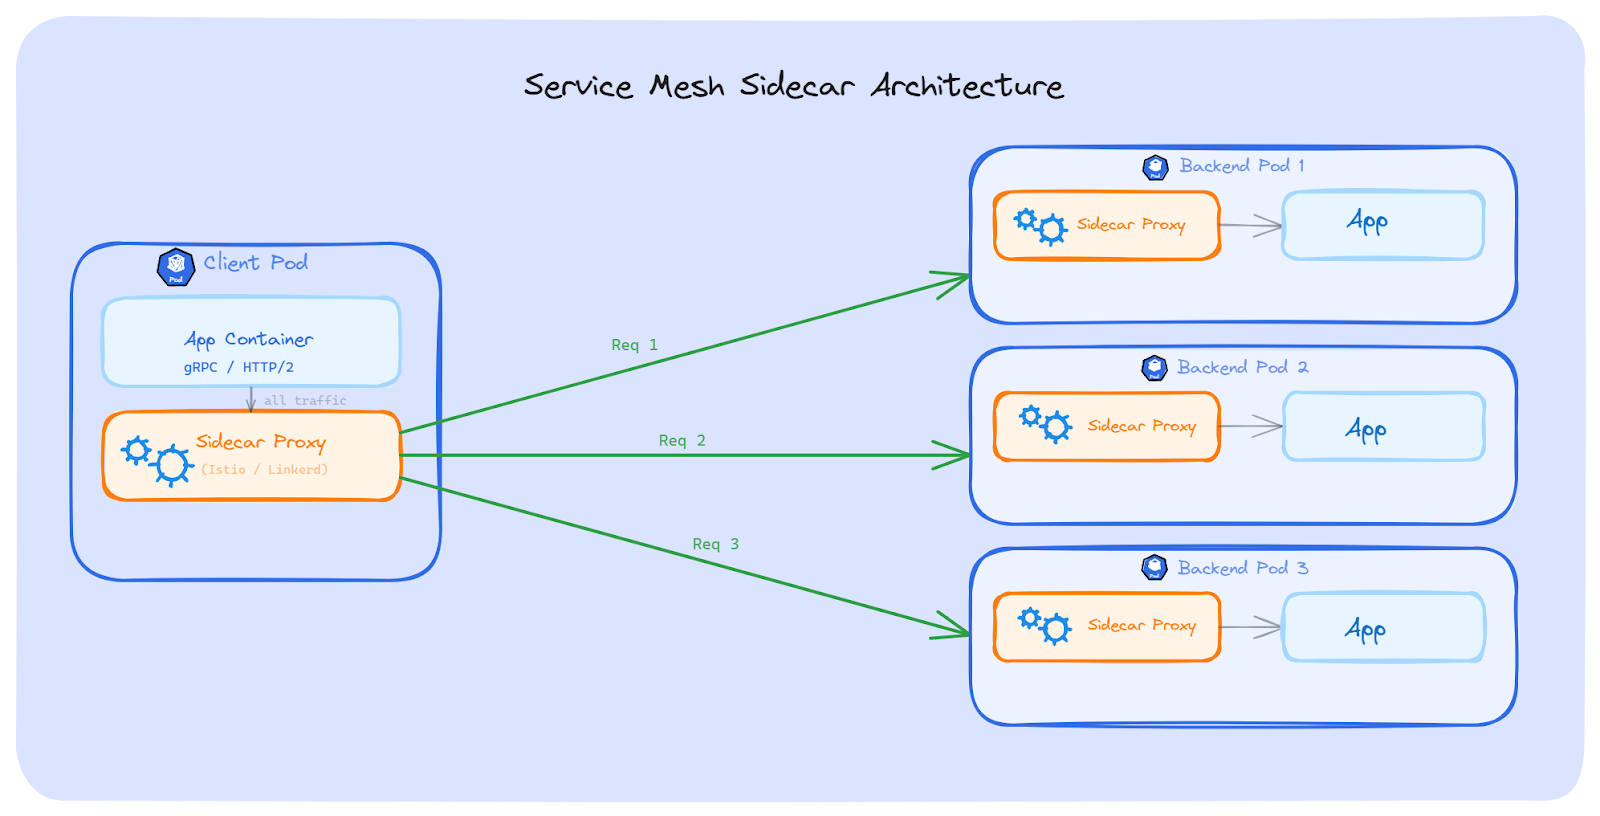
If we don't want to change our app code and we don't want to manage a separate proxy Deployment, a service mesh is another option. A service mesh adds load balancing, security, and observability to our Services, without touching any app code.
In the traditional setup, a service mesh injects a sidecar proxy next to every Pod. All traffic going in and out of the Pod passes through this sidecar. The sidecar does the same thing we talked about with Envoy; it sees each request inside the connection and routes them to different backend Pods.
The difference from the standalone proxy approach is that we don't deploy or manage the proxy ourselves. The mesh control plane handles everything; injecting the sidecar, discovering Pods, managing connections, and balancing requests.
There are no code changes. No extra deployments to manage. Just enable the mesh on a namespace, and it handles the rest.
Istio is the most popular service mesh. It supports traffic splitting, retries, circuit breaking, mutual TLS, and Layer 7 load balancing. It solves the long-lived connection problem because its proxies see each request inside the connection and route them to different Pods.
Istio has two modes now:
Sidecar mode (classic): An Envoy proxy is injected into every Pod. All traffic goes through it. This works well but adds CPU and memory to every Pod. At scale (thousands of Pods), the resource cost adds up. Upgrading the proxy also means restarting all Pods.
Ambient mode (newer): This mode removes sidecars completely, and it's stable since Istio 1.24. Instead, it uses a per-node proxy called ztunnel for Layer 4 traffic (mTLS, basic routing), and optional per-namespace waypoint proxies for Layer 7 features (request-level load balancing, retries, traffic splitting). Ambient mode uses fewer resources and doesn't need Pod restarts for proxy upgrades.
For our long-lived connection problem, ambient mode needs a waypoint proxy enabled on the namespace, because request-level load balancing is a Layer 7 feature.
Linkerd is a lighter service mesh. Its proxy (linkerd2-proxy) is written in Rust, which makes it smaller and faster than Envoy. It uses less CPU and memory per Pod.
Linkerd uses the sidecar model. It automatically does Layer 7 load balancing for HTTP, HTTP/2, and gRPC. It also supports mutual TLS, retries, and timeouts.
For teams that want L7 load balancing without the complexity of Istio, Linkerd is a good choice.
Both Istio and Linkerd solve the long-lived connection problem automatically as long as the mesh is enabled on the namespace.
A service mesh helps with more than just load balancing. But it comes with cost:
The solutions we've talked about so far, such as client-side load balancing, L7 proxies, and service meshes; work great for HTTP, gRPC, and WebSockets. But databases have a different story.
Almost every app uses a connection pool to talk to its database. The pool opens a set of connections at startup and keeps them alive for the app's entire lifetime. These connections are long-lived by nature; they can last hours or even days.
If the database runs behind a Kubernetes Service, iptables picks a backend Pod when each connection in the pool is created. Once the pool is set up, those connections don't move. All queries go to the same Pod (or the same few Pods), even if we have more replicas available.
The problem is the same as gRPC or HTTP/2; long-lived connections stick to one Pod. But the fix is different. With gRPC, we can change the client to use round-robin. With databases, we usually can't change how the database driver manages connections. Most drivers don't support request-level load balancing; they send all queries on the same connection.
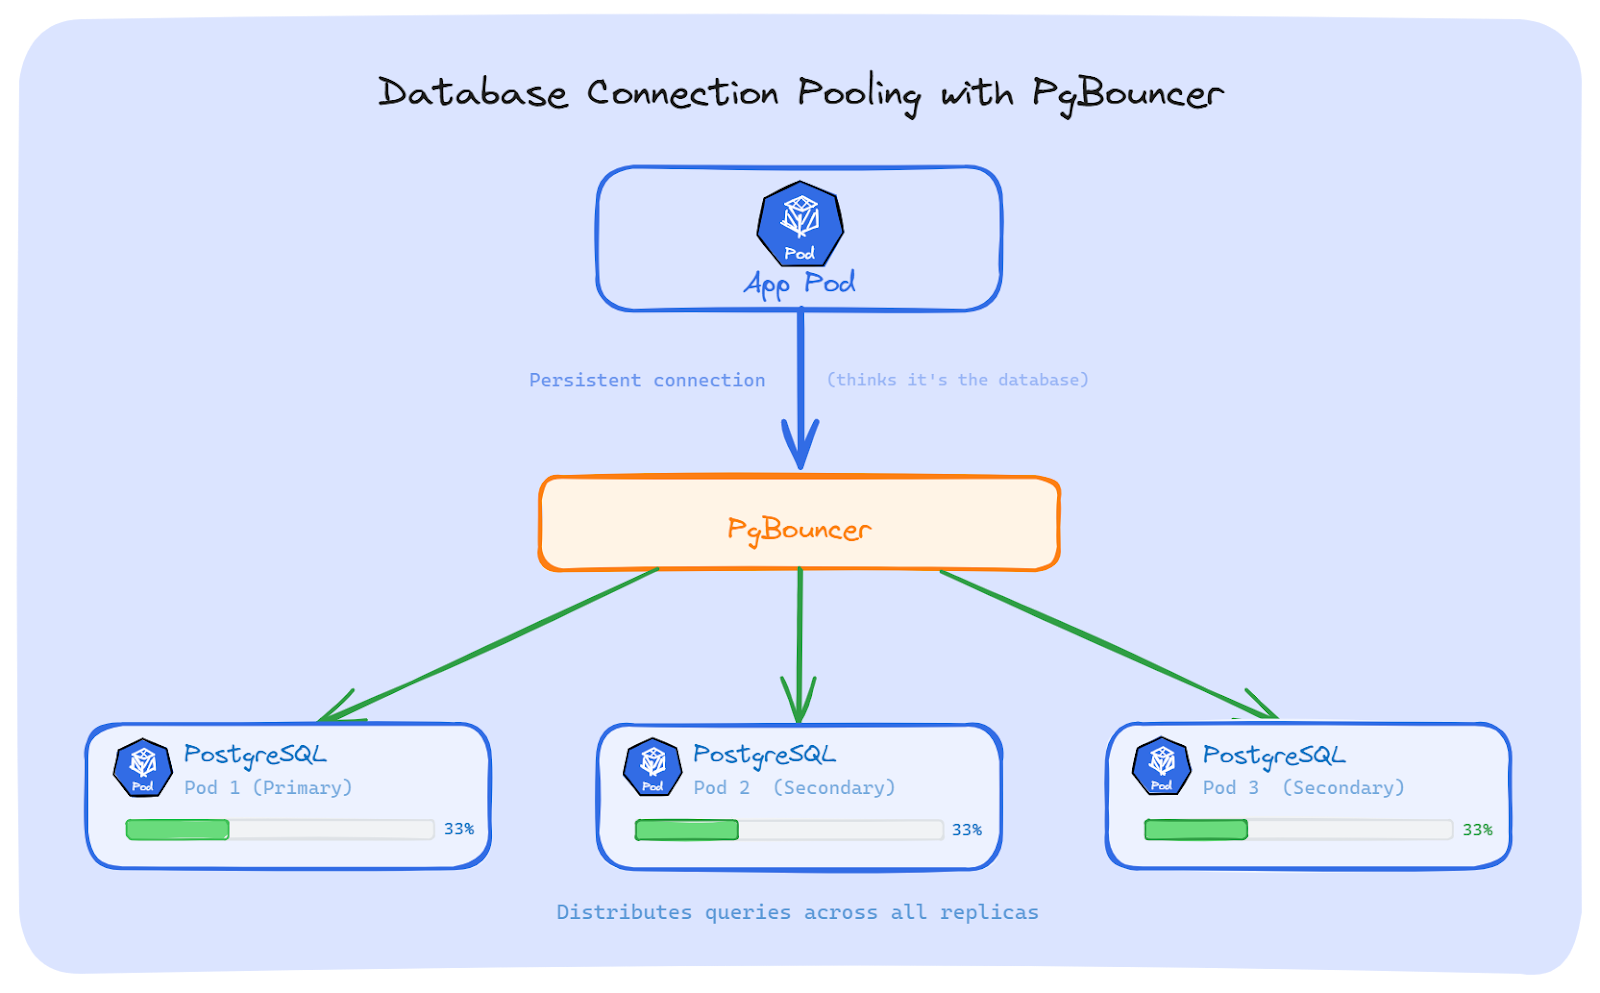
The most common fix for PostgreSQL is to put a connection pooler between the app and the database.
PgBouncer: It is a lightweight connection pooler for PostgreSQL. Our app connects to PgBouncer as if it were the database. PgBouncer then opens its own connections to the PostgreSQL replicas and spreads queries across them. It's small, fast, and does one job well.
Pgpool-II: It does more than pooling. It also supports load balancing across replicas, replication management, and query caching. It's heavier than PgBouncer, but useful if we need those extra features.
Both work the same way at a high level: the app talks to the pooler, and the pooler talks to the database Pods. The app doesn't know or care how many replicas exist.
If we're using Java with PostgreSQL, the JDBC driver has a built-in option for load balancing. We can list multiple hosts in the connection string and set loadBalanceHosts=true:
jdbc:postgresql://pg-0.postgres-headless:5432,pg-1.postgres-headless:5432,pg-2.postgres-headless:5432/mydb?targetServerType=any&loadBalanceHosts=trueA few things to know about this:
The Connection poolers and multi-host drivers fix the problem, but they come with some limits:
There's no single answer that works for everyone. The right fix depends on what protocol we use, whether we can change our code, and how much complexity we're okay with.
Here's a quick comparison:
We have talked about the problem and the solutions. But how do we know if we have this problem in the first place? Here are the signs to look for and the commands to check.
There are three common signs that long-lived connections are causing uneven traffic:
Start with kubectl top to see CPU and memory per Pod:
# Check CPU and memory for all Pods with a specific label
kubectl top pods -l app=my-backend
If we want to see big differences between Pods, dig deeper.
Check how many Pods are behind the Service:
# List all Pod IPs behind a Service
kubectl get endpointslice -l kubernetes.io/service-name=my-backend
Now check how connections are spread across those Pods. We can run this from a node or a debug container:
# Count active TCP connections to a specific Pod IP
ss -ant | grep <pod-ip> | wc -l
Or check all backend Pods at once:
# Show connection count for each backend Pod
for ip in $(kubectl get endpointslice -l kubernetes.io/service-name=my-backend \
  -o jsonpath='{.items[*].endpoints[*].addresses[0]}'); do
  echo "$ip: $(ss -ant | grep $ip | wc -l) connections"
done
one Pod has 200 connections and the others have 2, we've found the problem.
We can also check the conntrack table to see which connections are stuck to which Pod:
# Show conntrack entries for a Service IP
conntrack -L -d <service-cluster-ip> 2>/dev/null | head -20
This shows the NAT mappings; which source is connected to which backend Pod.
If we run Prometheus with kube-state-metrics, we can check traffic spread across Pods with these queries:
# Request rate per Pod - look for uneven numbers
sum(rate(http_requests_total{app="my-backend"}[5m])) by (pod)

# CPU usage per Pod - compare the spread
sum(rate(container_cpu_usage_seconds_total{container="my-backend"}[5m])) by (pod)
If one Pod shows 10x the request rate or CPU of the others, long-lived connections are likely the cause.
A quick tip: set up a Grafana dashboard that shows per-Pod CPU and request rate side by side. When the lines are close together, traffic is balanced. When one line is way above the others, something is wrong.
Kubernetes Services balance connections, not requests. This works fine for short-lived connections, but breaks for gRPC, HTTP/2, WebSockets, database pools, and AMQP.
Kubernetes has no built-in way to load balance long-lived connections. We can fix it in the client using a Headless Service with round-robin, put an L7 proxy like Envoy in front of the backend, use a service mesh, or add a database connection pooler like PgBouncer.
The first step is always to detect the problem. We can't fix what we can't see.