
If you work with Kubernetes for some time, you end up typing the same kubectl commands again and again.
We run a command to get pods, copy the name, check logs, describe it, and maybe edit it. After a while, it feels repetitive and slow. It gets even worse at 2 AM when something is broken, and we just want to quickly understand what is wrong.
That’s where k9s comes in.
In this guide, we will learn how to install it, how to use it for work, and some advanced features that many people miss. Let’s start.
k9s is a terminal-based tool that gives us a live view of our Kubernetes cluster. When we open it, and we can see our pods, deployments, services, and everything right there. There is no need to type commands. We just use our keyboard and press a key to do things like check logs, describe a resource, edit YAML, or delete something.
It talks to the same Kubernetes API that kubectl uses. So if our kubeconfig is set up, k9s will surely work. There is no need for extra setup and extra permissions. Whatever our RBAC allows us to do with kubectl, we can do the same in k9s.
The view refreshes every 2 seconds by default. So if a pod crashes or a new deployment rolls out, we see it happen live.
One thing that makes k9s really useful in production is that it runs fully inside the terminal. That means we can SSH into a bastion host or a jump server and run k9s there. For teams that access clusters through SSH, this alone is a big deal.
Before we install, we need a few things ready. kubectl should be set up and pointing to a working cluster. Our terminal should support 256 colors; most modern terminals do.
k9s works on Linux, macOS, and Windows. We will pick whichever way fits our setup:
# macOS / Linux (Homebrew)
brew install derailed/k9s/k9s

# Ubuntu / Debian
wget https://github.com/derailed/k9s/releases/latest/download/k9s_linux_amd64.deb
sudo apt install ./k9s_linux_amd64.deb

# Windows (Winget)
winget install k9s

# Go (NOTE: this installs the dev version, not stable)
go install github.com/derailed/k9s@latest

# Docker
docker run --rm -it -v $KUBECONFIG:/root/.kube/config quay.io/derailed/k9s
Before we launch, set two things:
export TERM=xterm-256color # needed for k9s to show colors properly
export KUBE_EDITOR=vim # or nano, or whatever we preferWhen k9s opens, the screen has a simple layout. The top area shows our cluster name, current context, Kubernetes version, and CPU/memory usage. Right below the top area, we see the resource table with all our resources listed. And at the very bottom, there is a breadcrumb trail that shows where we are, plus a small status message.
When we press : or /, a command bar pops up between the top area and the table. It is not always visible; it only shows up when we need it.
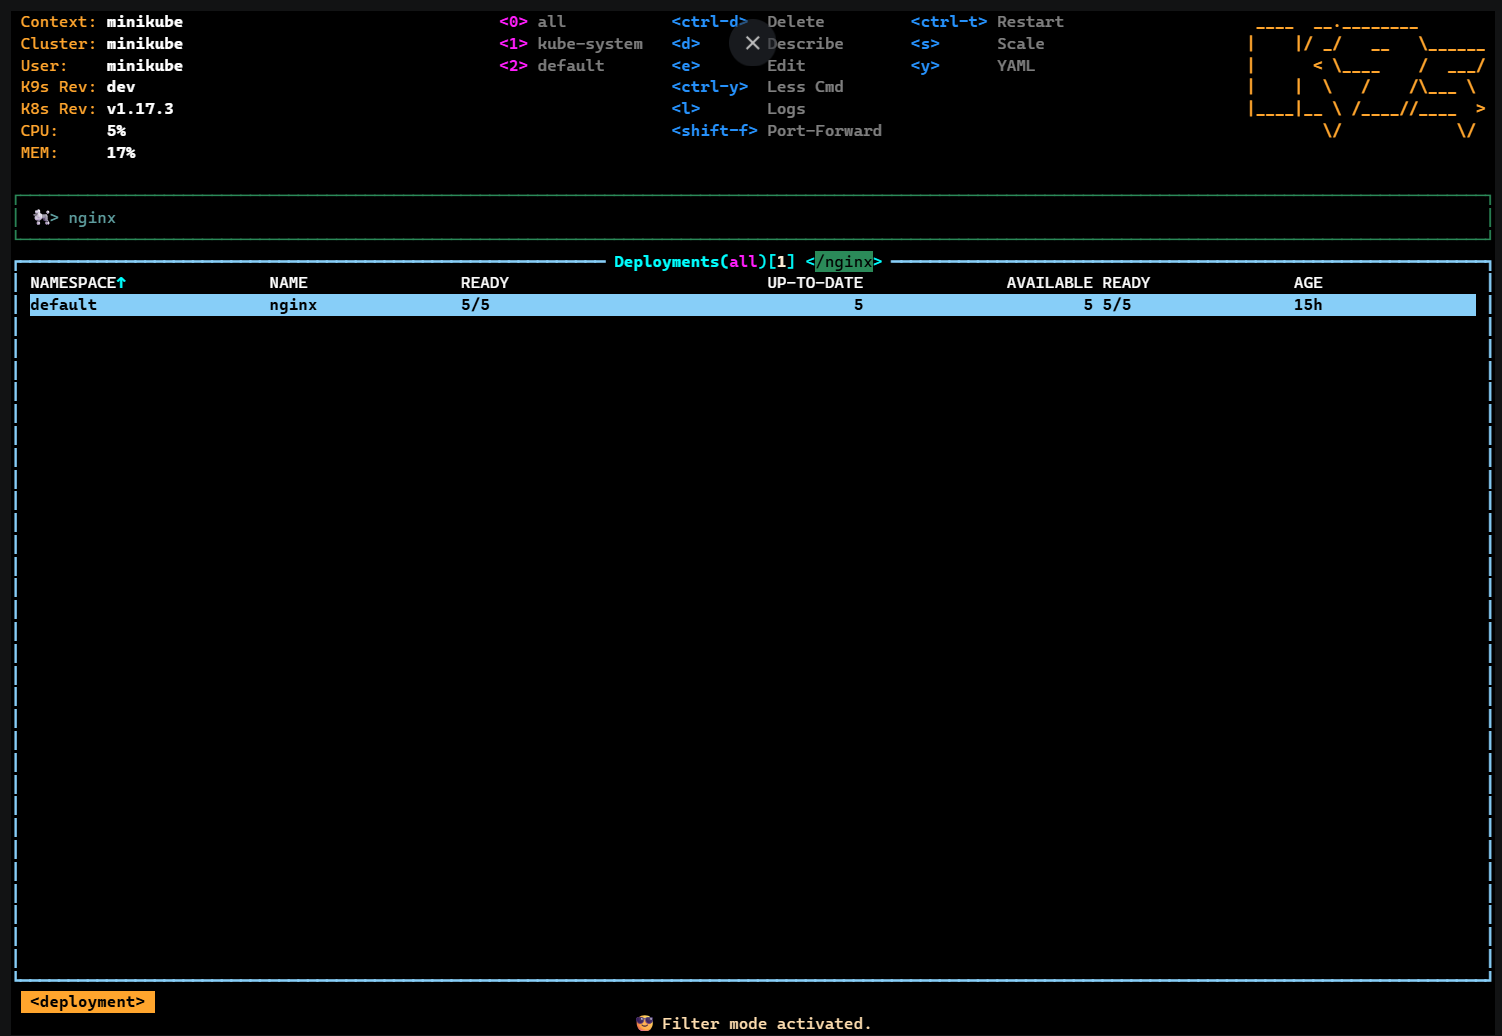
We will also notice small numbers at the top next to namespace names. Pressing 0 shows resources from all namespaces. The other numbers like 1, 2, 3 get assigned as we visit different namespaces. They are not fixed; k9s builds them based on what we use. We can also mark our favourite namespaces in the config, and they will always show up there.
Here is how we work with k9s:
A. To jump to a resource: We have to press : and type a resource name. :pod shows pods, :deploy shows deployments, and :svc shows services. We can also type :pod kube-system to see pods in a specific namespace. It accepts full names, short names, and aliases; all of them work.
B. To filter the current view: We have to press / and start typing. k9s supports regex, so /fred|blee works. We can filter by labels with /-l app=nginx, use fuzzy search with /-f, or do an inverse match with /!error to see everything that does NOT match.
C. To move around: We have to use arrow keys or j/k like vim. Press Enter to go into a resource, and Esc to go back. As we go deeper; suppose from a deployment into its pods, then into a container, then into logs; k9s shows the full path at the bottom like a breadcrumb trail.
One more thing; the shortcuts shown at the top of the screen change based on what we are looking at. On pods, <s> means Shell. On deployments, <s> means Scale. We don't need to memorize this; k9s always shows the right shortcuts for the current view.
There are two shortcuts that we should remember, ? opens help from anywhere in k9s, and Ctrl+a shows every resource alias k9s knows about. When we are not sure what the short name for something is, Ctrl+a is the answer.
Here is a quick reference of the shortcuts that we will use most often.
These shortcuts change depending on the resource we are looking at. K9s always show the available ones at the top of the screen.
k9s also supports sorting by columns. The sort shortcuts show up when we press ? in any view, and they change depending on which resource we are looking at.
We know shortcuts are one thing, but when to use them is another. Here are a few workflows we follow almost every day.
We open k9s and type :pulses. This shows a quick summary of the whole cluster; how many deployments, pods, statefulsets, daemonsets, and jobs are running, and how many have issues. One screen, everything at a glance. This takes about 60 seconds.
Next, :node to check our nodes. We look for anything that is not Ready, or any node showing MemoryPressure or DiskPressure. If a node has problems, the pods running on it will have problems too.
Then :pod, press 0 to see all namespaces, and quickly scan the STATUS column. We are looking for CrashLoopBackOff, Error, Pending, or ImagePullBackOff. These are the ones that need attention.
Suppose we got an alert that a deployment is not healthy. Here is how we walk through it in k9s:
This whole flow takes a couple of minutes. With kubectl, we would be typing five or six commands to do the same thing.
When a pod has multiple containers, we select the pod, press Enter to see the containers, pick the one we want, and press l for logs.
Inside the log view, we can type /error or /timeout to filter for specific lines. We have to press Ctrl+s to save the logs to disk before they rotate away.
One tip that is easy to miss: if a pod keeps crashing and restarting, pressing l shows the logs of the current container, which might be empty because it just started. To see what actually caused the crash, go back to the pod view and press Shift+L. This shows the previous container's logs, the one that crashed. That is where the real error message lives.
k9s can do a lot more than just moving around and pressing shortcuts. Most people never use these features, but they are really helpful once we know about them.
We already used :pulses in our morning health check to get a quick overview of the cluster.
We have to type:xray deploy or :xray deploy <namespace> and k9s shows a tree of relationships. A deployment breaks down into its ReplicaSets, which break down into Pods, which break down into Containers. It works with other resources too; we can use :xray svc, :xray sts, :xray ds, :xray rs.
This is really useful when we want to quickly trace which pod belongs to which deployment, or which containers are inside a specific pod. With kubectl we would need multiple commands to get this picture. With xray, it is one screen.
We have to type:popeye and k9s runs a scan of our cluster against best-practice rules. It looks for things like port mismatches, unused resources, missing probes, container image issues, resource over/under allocations, RBAC misconfigurations, and pods running on their own without any controller like a Deployment or ReplicaSet. It marks each resource as OK, Info, Warn, or Error. And at the end, we get one overall score for the whole cluster.
Popeye is actually a separate tool made by the same developer who created k9s. But it is built into k9s so we can run it without installing anything extra. If we want to customize what it checks, we can create a spinach.yml config file per cluster.
k9s lets us look at RBAC rules too. We can type :clusterrole, :role, :rolebinding, or :clusterrolebinding to see who has access to what. It also supports reverse lookup; meaning we can check what a specific user or ServiceAccount is allowed to do. Press ? inside any RBAC view to see what actions are available.
k9s lets us create our own custom commands. These are called plugins. We write them in a file called $XDG_CONFIG_HOME/k9s/plugins.yaml. We can also put separate plugin files in the $XDG_DATA_HOME/k9s/plugins/ folder.
Here is a simple example.
plugins:
  debug:
    shortCut: Shift-D
    description: Debug pod
    scopes:
      - pods
    command: kubectl
    background: false
    args:
      - debug
      - -it
      - $NAME
      - -n
      - $NAMESPACE
      - --image=busybox
When we are looking at pods, pressing Shift+D will run this on whatever pod we have selected. k9s gives us variables like $NAME, $NAMESPACE, $CONTEXT, and $CLUSTER that we can use in our commands.
There is also an official collection of ready-made plugins on the k9s GitHub repository that we can use right away
k9s keeps its config files under the XDG directory structure. The exact paths depend on the operating system. The easiest way to find them is to run:
k9s infoThis shows where k9s is looking for its config, plugins, hotkeys, skins, aliases, and logs. On Linux, it is usually ~/.config/k9s/ for config and ~/.local/share/k9s/ for data.
The main config file is config.yaml. Here are a few options worth changing:
k9s:
  refreshRate: 2        # how often k9s polls the API, in seconds. Make it higher for slow or remote clusters
  readOnly: false        # set to true on production clusters to block delete/edit/kill
  noExitOnCtrlC: false   # set to true so we don't accidentally close k9s with Ctrl+C
  ui:
    logoless: false      # set to true to hide the k9s logo and save screen space
skin: dracula # name of the skin file without the .yaml extensionWe can set up our own keyboard shortcuts. The hotkeys file is in the k9s config directory (run k9s info to find the exact path). Here is a simple example:
hotKeys:
  shift-1:
    shortCut: Shift-1
    description: Pods
    command: pods
  shift-2:
    shortCut: Shift-2
    description: Deployments
    command: dp
Now pressing Shift+1 takes us straight to pods, and Shift+2 goes to deployments. We can set up any shortcuts we want, as long as they don't conflict with the built-in ones.
k9s supports custom skins to change how it looks. We drop a .yaml file in the skins folder and reference it in our config with skin: name. Some popular community skins are dracula, monokai, nord, and gruvbox. The official repo has a collection of them.
These are small things, but they matter when we are working on production clusters.
k9s is a great tool, but it has some limitations:
k9s does not replace kubectl. But for the work we do by hand every day like checking pods, reading logs, describing resources, switching namespaces; it makes things a lot faster. Instead of typing commands again and again, we press a key or two and get what we need.
It works right in the terminal, so we can use it over SSH on production bastion hosts without any extra setup.
Always use --readonly on production clusters. One wrong key press without it can cause real problems.
There are Views like :pulses, :xray, and :popeye give us a quick picture of the whole cluster in seconds. Most people never try them, but they are really useful.
Plugins and hotkeys let us set up k9s the way we like. And if we put our config in a Git repo, the whole team gets the same setup from day one.